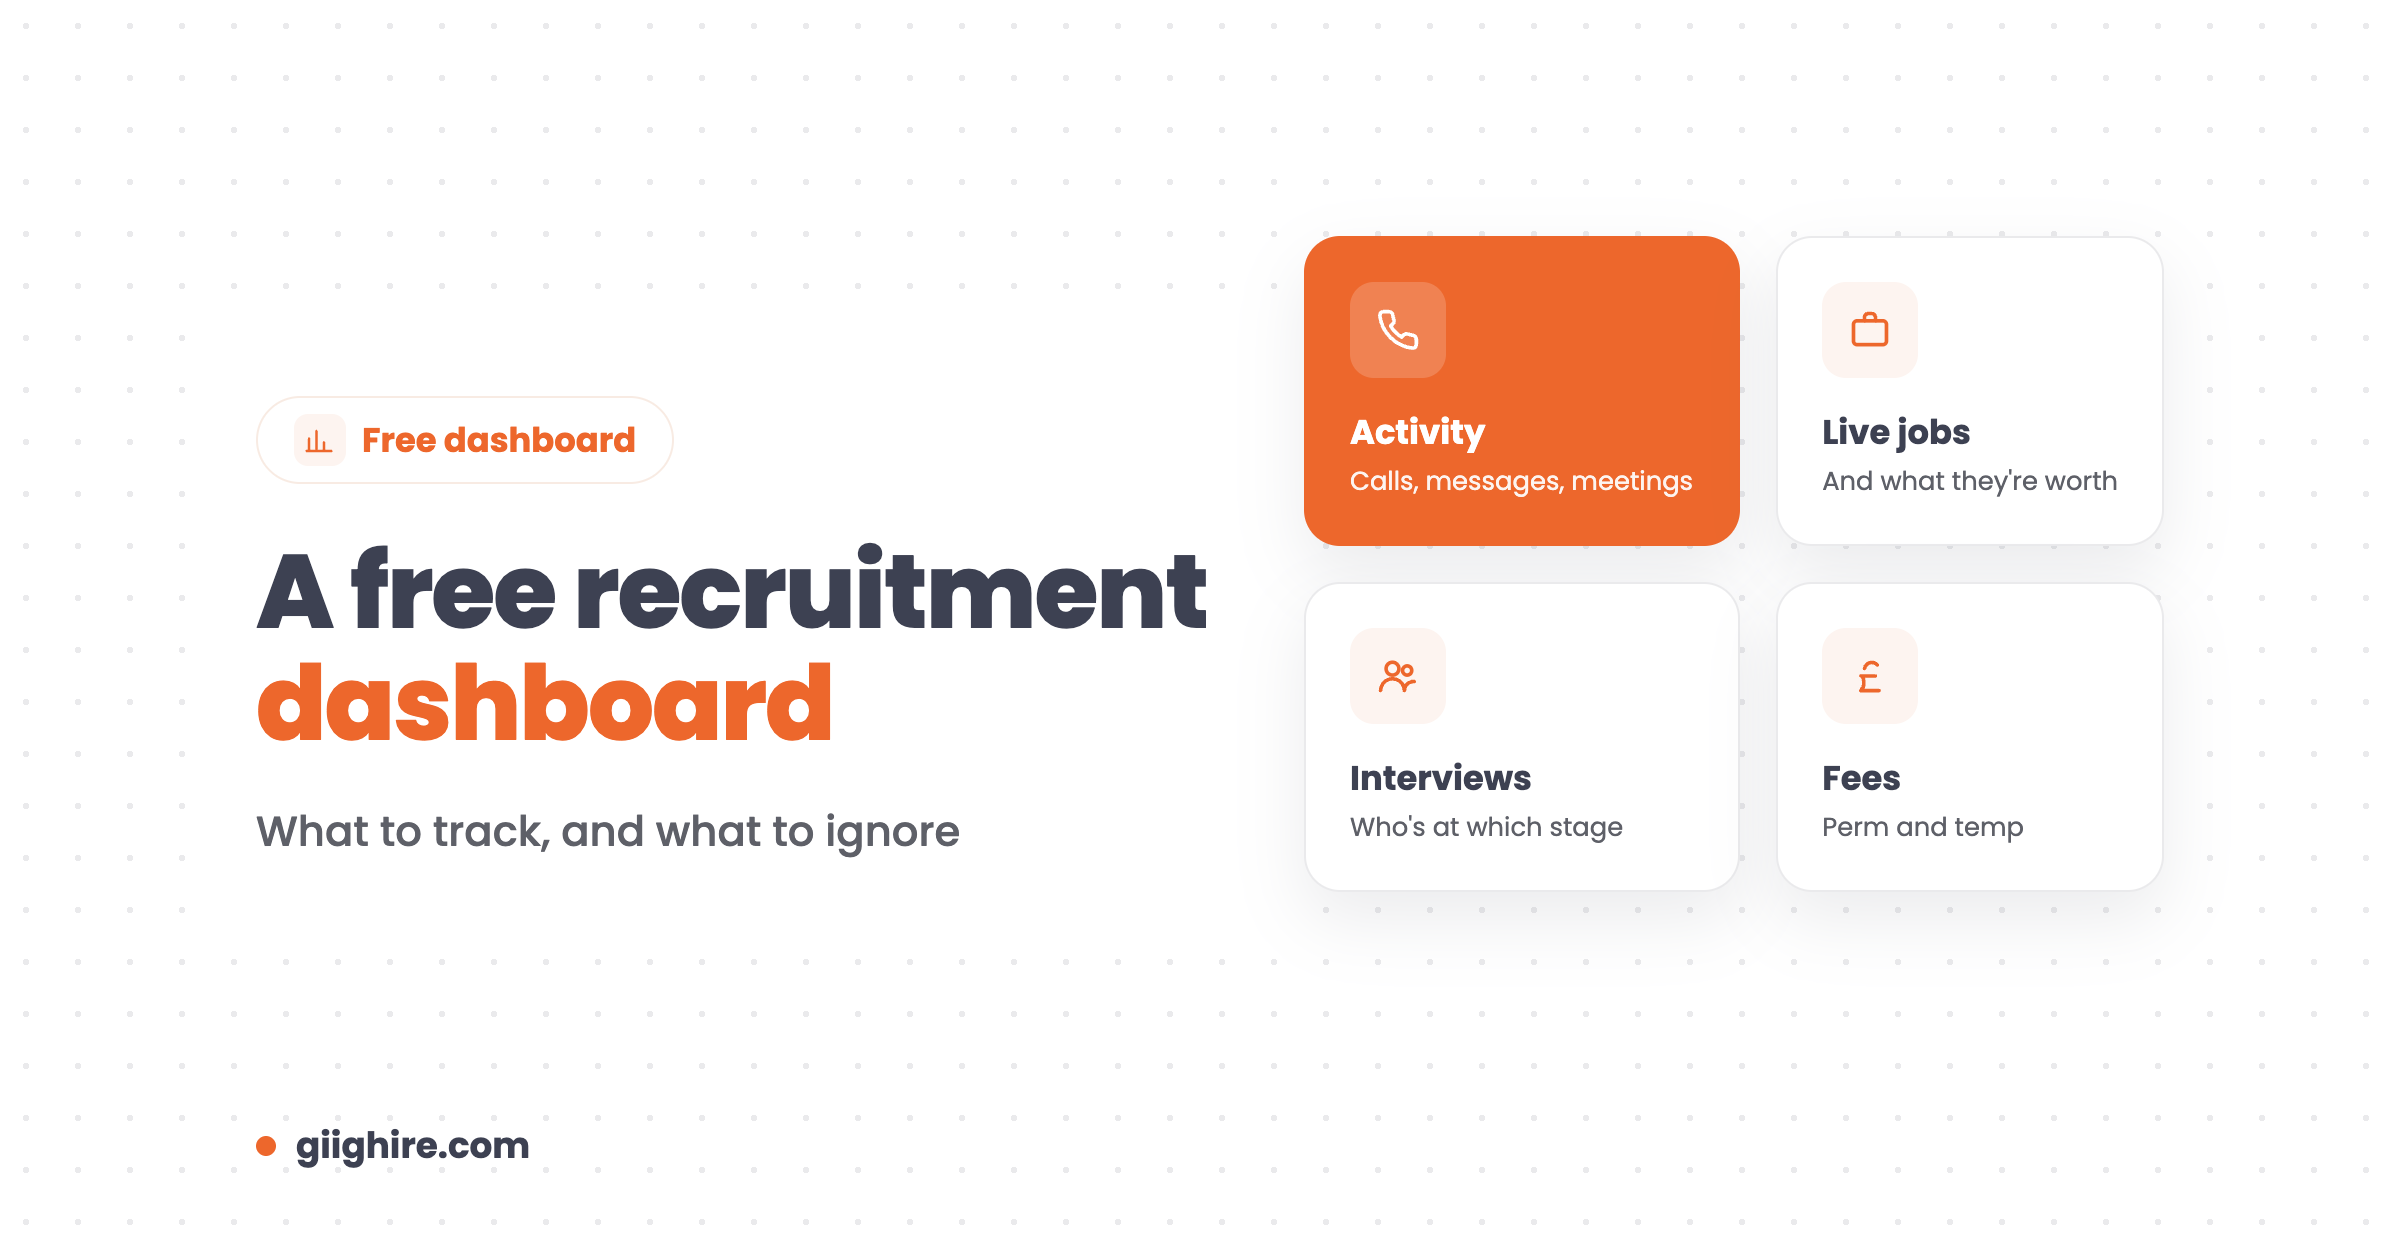
A recruitment dashboard is one screen that shows how your agency is doing: activity, jobs, candidates in process and fees, without digging through spreadsheets. You can get one free: Giig’s Free Forever plan includes a dashboard with your database growth, interview pipeline and live jobs. Track a handful of numbers that lead to placements, check them weekly, and ignore the rest.
When you’re starting out it’s tempting to skip the numbers and just get on with it. I get it. Recruitment software is expensive, so people track things in Excel, or don’t track them at all. But not knowing your numbers is like running the business blindfolded. You only find out something’s wrong when the fees stop.
What is a recruitment dashboard?
A recruitment dashboard is a visual summary of your recruitment KPIs, pulled straight from your CRM, so you can see activity, pipeline and results at a glance.
A good one answers three questions in under a minute:
Are we doing enough of the right activity?
What’s in the pipeline, and what’s it worth?
Where are deals getting stuck?
Why does a small agency need a dashboard?
Because KPIs aren’t corporate box-ticking. They’re survival maths: how many calls make a job, how many CVs make an interview, how many interviews make a placement.
There’s a corporate version of reporting that everyone hates: a 30-slide deck, targets nobody believes and meetings about meetings. That’s not what a small agency needs. A small agency needs an honest mirror. If you know that roughly every three interviews lead to one offer, and you need two placements this month, you know exactly how many interviews you need to be lining up. That’s not micromanagement. That’s knowing whether you’ll pay the bills.
A dashboard helps you:
Spot problems early, like a quiet BD week that’ll show up as no jobs next month
Forecast fees, so a slow month isn’t a surprise
See what’s working, so you can do more of it
Keep the team honest, you included
The recruitment KPIs worth tracking
Track a few numbers across activity, pipeline and results, because those are what actually move fees.
Area
KPI
Why it matters
Activity
Calls, messages and meetings
Nothing happens without them
Activity
New candidates, contacts and companies added
Shows your database and BD are growing
Pipeline
Live jobs and their total fee value
What you could bill if you fill them
Pipeline
Candidates at each interview stage
Where deals are, and where they’re stuck
Conversion
CVs sent to interview
Tells you if your shortlists are good enough
Conversion
Interview to offer, offer to acceptance
Shows where deals fall over
Results
Placements and fees, perm and temp
The number that pays the bills
Speed
Time to fill
Slow roles cost you candidates and clients
If you only track three, make it: activity, CVs sent to interview, and fees in the pipeline.
Vanity metrics to ignore
Ignore numbers that look busy but don’t lead to placements.
Total database size on its own (5,000 untagged CVs isn’t an asset)
LinkedIn followers and post likes
Emails sent, without replies
Number of jobs taken, if half of them were never fillable
Activity only counts if it turns into conversations, and conversations only count if they turn into placements.
What’s in Giig’s free recruitment dashboard?
The Free Forever plan gives you a dashboard out of the box, built from the data you already add to your CRM. No setup, no spreadsheet formulas.
It shows:
Growth: how many candidates, contacts and companies you’ve added
Interview pipeline: where your candidates are, from shortlisted to hired
The free plan is for one user, with unlimited candidates, jobs and clients, and no credit card.
When to upgrade to advanced reporting
Upgrade when you’ve got a team, or when you want to see the activity behind the numbers, not just the totals.
Advanced reporting is on Giig Plus (£45 per user/month +VAT, no contract, cancel anytime). It adds:
The full funnel, from first outreach calls and messages, through jobs and CVs sent, to offers accepted
Consultant leaderboards, so you can see who’s driving activity, from calls made to hires closed. Permissions let you restrict who sees it
Filter by consultant, or roll up the whole team
Activity by subject, so you can see cold outreach versus follow-ups versus interview prep
Every touchpoint tracked: calls, LinkedIn messages, WhatsApp, SMS, email and meetings
Drill into the notes, so a “50 calls” number opens up the actual conversations behind it
This Year, This Quarter or All Time views in one click
On Giig AI you can also ask Claude about your CRM, like “which clients haven’t we spoken to in three months?”, and get an answer without building a report.
How to set up your dashboard in 4 steps
Get your data into one place, use the same stages every time, log your activity, and look at it every week.
Put everything in your CRM. Candidates, clients, jobs and notes. A dashboard is only as good as what goes into it.
Use the same pipeline stages for every job, so the numbers compare like for like.
Log calls, messages and meetings as you go, not at the end of the week.
Book 15 minutes every Monday to look at last week’s numbers and decide one thing to change.
Frequently asked questions
What is a recruitment dashboard?
A recruitment dashboard is a single screen showing your key recruitment numbers, like activity, live jobs, candidates in process and fees, pulled automatically from your CRM. It lets you see how the agency is doing without building spreadsheets.
Is there a free recruitment dashboard?
Yes. Giig’s Free Forever plan includes a dashboard showing your database growth, interview pipeline and live jobs, plus a jobs pipeline with total estimated fees. It’s free for one user, with no credit card and no trial period.
What KPIs should a recruitment agency track?
Start with activity (calls, messages, meetings), pipeline (live jobs and their value, candidates at each stage), conversion (CVs sent to interview, interview to offer) and results (placements and fees). Time to fill is worth tracking too.
Can I build a recruitment dashboard in Excel?
You can, but it relies on someone updating it by hand, and it goes out of date fast. A dashboard built into your CRM updates itself from the work you’re already logging, so the numbers are always current.
What’s the difference between a recruitment dashboard and recruitment reporting?
A dashboard is the at-a-glance view. Reporting goes deeper: filtering by consultant, breaking down activity by type, comparing periods and drilling into the notes behind each number. Giig includes core dashboards on every plan and advanced reporting on Giig Plus.
How often should I check my recruitment KPIs?
Weekly is enough for most small agencies. Look at last week’s activity and pipeline every Monday, and review conversion rates and fees monthly. Checking daily tends to create noise rather than decisions.
Final thoughts
You don’t need a data team to know how your agency is doing. You need a few honest numbers, in one place, that you actually look at. Start with the free dashboard, track activity, pipeline and fees, and upgrade to advanced reporting when the team grows.
Want your numbers without the spreadsheet? Start on Giig for free. No credit card, no contract.
This website uses cookies so that we can provide you with the best user experience possible. Cookie information is stored in your browser and performs functions such as recognising you when you return to our website and helping our team to understand which sections of the website you find most interesting and useful.
Strictly Necessary Cookies
Strictly Necessary Cookie should be enabled at all times so that we can save your preferences for cookie settings.
If you disable this cookie, we will not be able to save your preferences. This means that every time you visit this website you will need to enable or disable cookies again.